Elliott Wave Plus Informed Subscribers on Friday Morning of an Imminent Up Move in the Stock Market This Week

Elliott Wave Plus Informed Subscribers on Friday Morning of an Imminent Up Move in the Stock Market This Week
As we were headed into the weekend last week (Friday, May 15), many Elliotticians and market forecasting services were content holding on to their bearish positions regarding the stock market, and specifically the S&P-500. The Fed had previously stated that more measures were likely going to be needed to pull the economy out of its current downturn, Buffett was selling off millions of dollars of shares, and talk of major department stores filing for bankruptcy flooded the news. All of which made a very bearish outlook to almost every market forecaster . . . except from us.
Who Could Have Predicted This Huge Down Move In The Market?

On November 15, 2019, the S&P-500 reached 3120 for the first time ever. For the next 63 trading days, the S&P continued relentlessly higher, topping on Feb 19 at 3393. Just four days later, the S&P was back down to 3120, almost instantly erasing three full months of gains! Nobody could have seen that coming ahead of time, could they? We know of at least one person who did.
Have We Reached An Unsustainable Situation?

Gold & Bonds are typically correlated. As of this writing, that historic relationship appears to be intact. Compare that to Gold & the U.S dollar. Those two items typically move opposite (inverse) of each other. However, since mid-July 2019, they have generally been moving up and down together.
Bonds, which are the most popular alternative to stock ownership in the investment world, typically move opposite of the stock market. However, ever since the start of the new year (2020), stocks, bonds, gold and the US Dollar have all been rallying together. Is this a distortion that has developed because of mid-October 2019 Fed announcement of QE? Many think so. If so however, there was a delayed reaction of 2.5 months.
Is The Stock Market Losing Upward Momentum?

The most publicized stock market indices continue to hover near all-time highs, but is this market losing momentum? The answer is YES. Examine the following multi-timeframe screenshots of the Dow Jones Industrial Average (DJIA) with a standard RSI indicator on the bottom of the screen. The loss of momentum is clearly shown in the form of bearish RSI divergence.
Is a Dow Theory Non-Confirmation In Play?

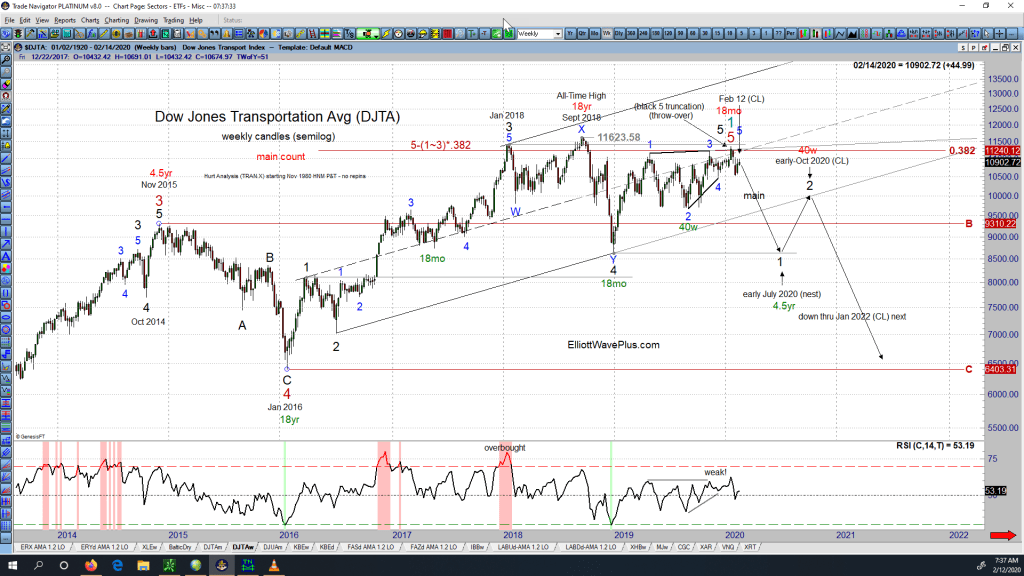
The original Dow Theory states that the market is in an upward trend if either the industrial or transportation index advances above a previous important high and is accompanied or followed by a similar advance in the other average. For example, if the Dow Jones Industrial Average (DJIA) climbs to a new all-time high, and the Dow Jones Transportation Average (DJTA) follows suit within a reasonable period of time, the upward trend is confirmed.
When the Stock Market Goes Down, Gold Goes Up. Right?

During the Jan 19 webinar, Sid showed an intermediate-term chart of Gold and the S&P-500 Index, one overlaid upon the other. The chart clearly showed that gold and the stock market don’t always move inversely, as many seem to believe. Sometimes the two items move opposite each other, but other times they generally move together, in positive correlation. For instance, since early October 2019, the two items have generally been moving to the upside together.
This video clip, taken from that January 19 weekly “Counts” webinar includes Sid’s discussion of the above myth, as well as his chart of Gold vs. the S&P. For those who believe that Gold will “save them” when the stock market crashes next, the video is worthy of consideration.
Are there potential trading profits to be made on both the upside and downside of the S&P as well as Gold? Absolutely. But the two items really should be analyzed and traded independently.
Bonus screenshot from the January 26 weekly webinar. Notice how highly correlated the S&P and the XAU (Gold & Silver Sector Index) have been since early October.
The Quarterly Premium Plan Webinar

Quarterly Premium Plan Webinar 1-17-20. During this free webinar, we cover multiple topics such as:
The different levels of services offered at ElliottWavePlus.com (Crypto Plan, Basic Plan, Pro Plan, and our Premium Plan), How to navigate within our ElliottWavePlus.com website, Helping yourself to our Resources, Our Blog and how to use it, How to utilize our top-tier service – The Premium Plan.
Sid’s Current Analysis on Gold – January 12, 2020

Sid Norris of ElliottwavePlus.com, during the Sunday, January 12, 2020 weekly “counts” webinar for Pro-Plan subscribers describes his Elliott Wave count and associated Fibonacci price targets on Gold.


