What’s Driving the Markets this Year?
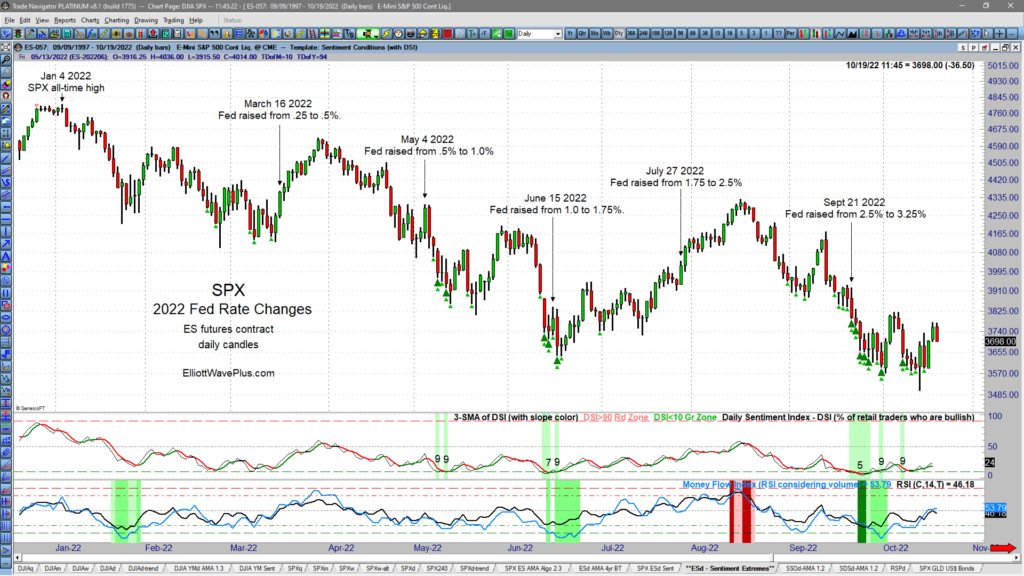
What’s been driving the markets this year? If your market research consists primarily of watching financial television channels, you’d swear that the Fed must be controlling all market movements like it was a puppet master! The vast majority of TV pundits will answer questions about where the market is going next with at least some mention of the Fed. Let’s look at all the Fed’s rate changes so far this year to see if they are producing consistent buy or sell signals for investors and traders.
U.S Dollar Index – Algo Trade Signals and Sentiment Positioning 2020

U.S Dollar Index – Algo Trade Signals and Sentiment Positioning 2020
It’s been another profitable month for our Nightly Algo Report for Premium Plan subscribers here at ElliottWavePlus.com. In this post. we’ll provide an in-depth look at the U.S Dollar Index, and the trade signals that our proprietary momentum algorithm has been producing. Remember, this is just one of twenty popularly traded items covered for our Premium Plan subscribers, who receive screenshots every evening (M-F), along with a summary “check list” PDF. Click here for a complete list of items covered.
The Current State of the US Stock Market, the US Dollar, and Gold. A free blog post by Sid Norris of ElliottWavePlus.com
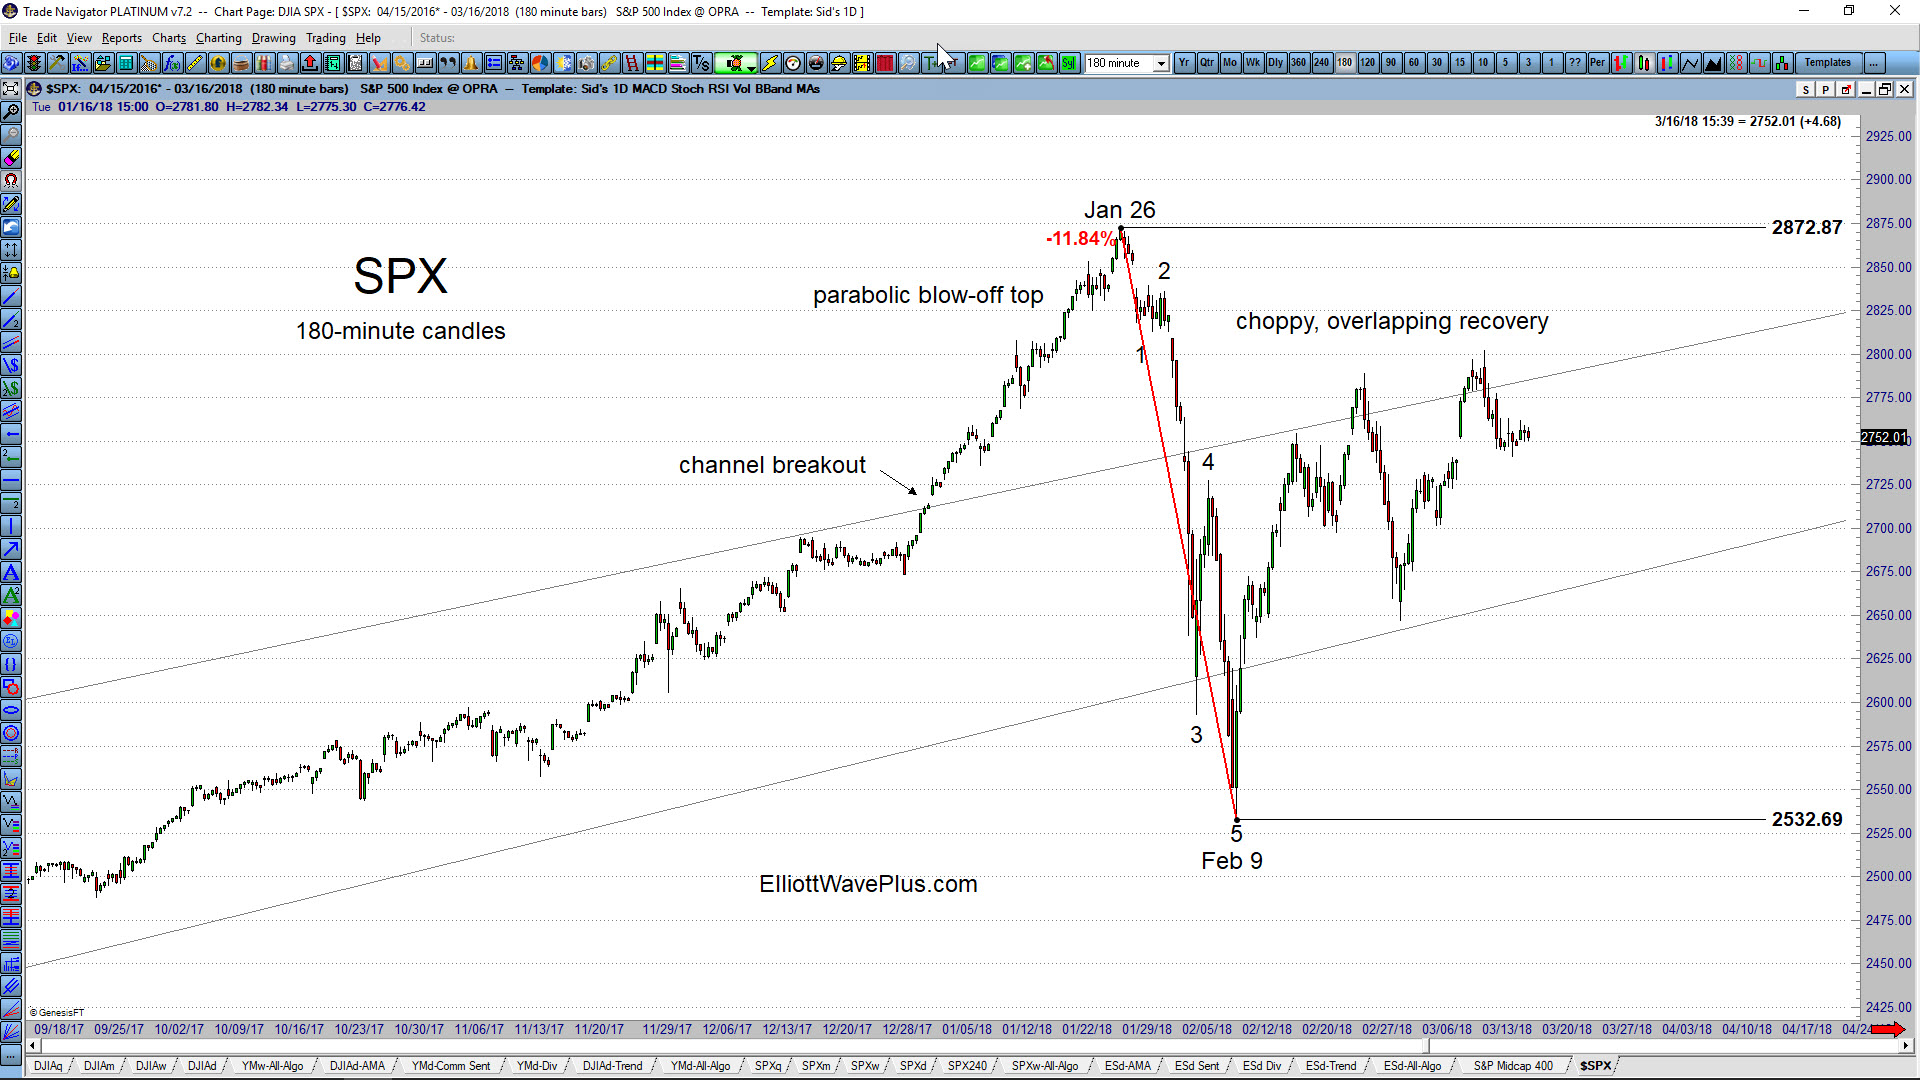
The S&P-500: The January rise in the US stock market went parabolic before topping on January 26. The 11.84% drop over the next 2 weeks (thru February 9) carved out a clear 5-wave impulse to the downside. The recovery so far appears to be choppy, overlapping, and corrective. From an Elliott Wave perspective, the aggressive move down thru Feb 9 is therefore very likely to be a wave 1 of a new downtrend, or a wave A within a 4th wave zigzag. Therefore, another 5-wave wave structure to the downside, taking out the Feb 9 low of 2532.69 would be a high probability expectation. Also possible within Elliott Wave theory is that the drop from Jan 26 thru Feb 9 was wave A within a wave 4 triangle. Only 4 of the 5 legs of a triangle are required to be a zigzag or zigzag combination. One of the legs can be something else, including a 5-wave impulse.
What’s Next for the US Dollar? (by Sid Norris of ElliottWavePlus.com)
The US Dollar has been quite weak since the beginning of last year. Will it continue to weaken? The monthly chart below shows my long-time main Elliott Wave count for the US Index, an unfinished ending contracting diagonal starting at the 1985 high. This wave count correctly expected the US Dollar to top near a .618 retacement of the downward wave from July 2001 through March 2008. That top came in early January 2017, and the Dollar has surprised many by moving strongly lower ever since. Hurst cycle analysis also correctly projected that top, and from a long-term perspective is quite bearish the Dollar moving forward, potentially all the way to the year 2027.
Thoughts on the Current State of the Stock Market (and other stuff) – A blog post by Sid Norris from ElliottWavePlus.com

Without further ado, here are the current combined Hurst projections on several items of interest:
1) US Stock Market: a major top in late 2017 is expected, to be followed by an ABC correction through the year 2024. (And no, I haven’t called the top yet like those super blogging, email blasting, google search manipulators! (-:) From an Elliott Wave perspective, the 5-wave impulse up from the March 2009 low is likely to end soon, though. That bull market will have lasted about 8.5 years, so even if the 2009-2017 bull was a very bullish cycle-degree wave 1 (my main count), a multi-year (cycle-degree) correction would be next.
Highlights from Sid’s Weekly “Counts” Webinar (August 9, 2015)
The video clip below contains highlights from my Weekly “Counts” webinar from three days ago (August 9, 2015). Included are portions of my analysis of the Dow Jones Industrial average, GDX, and the US Dollar Index. ALL of the calls in this video were contrarian against the so-called “consensus trades”, like long dollar, and short […]
Elliott Wave Analysis of the EUR/USD Currency Pair by Sid from ElliottWavePredictions.com
Elliott Wave Analysis of the EUR/USD Currency Pair by Sid from ElliottWavePredictions.com. Click on the charts to enlarge. There appears to be quite a debate going on these days about whether the Euro is finished going down or not. In my opinion, a combination of Elliott Wave and Hurst cycle analysis suggests that the March […]
Elliott Wave & Hurst Cycle Analysis of the U.S. Dollar Index (DX) by Sid from ElliottWavePredictions.com
Elliott Wave & Hurst Cycle Analysis of the U.S. Dollar Index (DX) by Sid from ElliottWavePredictions.com. Click on the charts twice to enlarge. Using a combination of Elliott Wave and Hurst Cycle analysis sometimes provides expectations that are not widely accepted. For instance, if my interpretation of the narrowing sideways chop in the US Dollar […]
Elliott Wave Analysis of the S&P-500 (SPX) and the US Dollar Index ETF (UUP) by Sid from ElliottWavePredictions.com
Elliott Wave Analysis of the S&P-500 (SPX) and the US Dollar Index ETF (UUP) by Sid from ElliottWavePredictions.com. Click on the charts twice to enlarge. The S&P-500 continues to stretch upward, and corrections are becoming more shallow and brief. It appears that the SPX is seeking the 1891.35 level, where cycle (teal) wave B will […]
Elliott Wave Analysis of the US Dollar Index (DX) by Sid from ElliottWavePredictions.com
Elliott Wave Analysis of the US Dollar Index (DX) by Sid from ElliottWavePredictions.com. Click on the chart twice to enlarge. The Dollar has weakened a bit further since the Fed announced Wednesday that they would double the amount of monthly printing of dollars moving forward, which begs the question: Is the Fed big enough and […]

