Dow Jones Industrial Average Call – October 29, 2023
Here’s a video clip of the October 29, 2023 webinar, where Sid predicted the 500 point up day in the Dow Jones Industrial Average.
The Stock Market is Entering 2023 at a Critical Juncture
The Stock Market Is Entering 2023 At A Critical Juncture
Summary
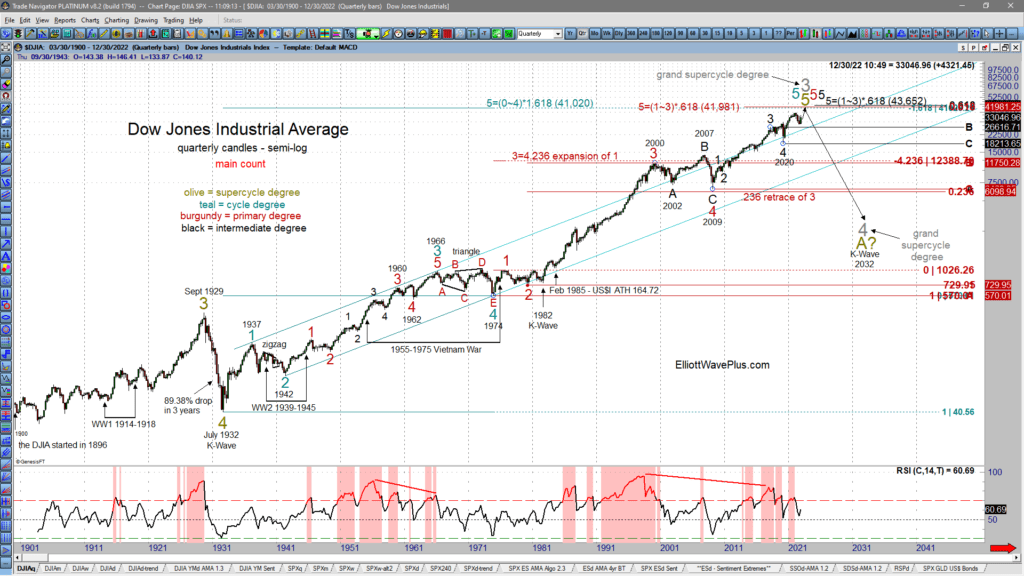
There is a cluster of three large-degree Fibonacci targets that suggest that the Dow Jones Industrial Average has not completed 5-waves up from the 1932, 1974 & 2009 lows yet.
The March 2020 low was an intermediate-degree (black) wave 4 low. There are two potential ways the market can finish a 5-wave structure up from that low.
Shorter-term, I’ve been tracking three potential wave counts for the S&P-500. The market could eliminate up to two of those counts during the first few weeks of the new year.
Our method of combining Elliott wave and its associated Fibonacci price targets, Hurst cycle analysis, sentiment extremes, momentum, volume signatures and more provide higher confidence trading forecasts than Elliott wave theory when used alone.
Dow Jones Industrial Average | Comprehensive Technical Analysis
Dow Jones Industrial Average – Comprehensive Technical Analysis
Today’s video post is an excerpt of our January 2, 2022 weekly Counts webinar for Pro and Premium Plan subscribers at ElliottWavePlus.com. This excerpt consists of Sid’s highly detailed coverage of the Dow Jones Industrial Average. Sid starts by showing a cluster of several long-term Fibonacci targets in the 41-44K range on the Dow.
Sid explains that all this market needs to produce that grand Supercycle wave 3 top is a completed 5-wave structure up from the March 2020 low into that long-term target range. At this juncture, it appears that a 5-wave non-overlapping impulse is well underway from that March 2020 low. Hurst cycle analysis is current projecting that a major top will occur in the Dow in approximately late-May 2022. The Hurst projected top on the highly correlated S&P-500 is a little later, in late-Sept 2022.
Educational Course: Fibonacci Price Targets

Our friends at Elliott Wave International have allowed us to share some excellent education content with our subscribers! We are happy to share one of their most popular courses, for free. The 4-hour course teaches traders how to use Fibonacci levels to trade with more confidence. We use Fibonacci price targets extensively in our analysis to form our Elliott Wave counts, and we think you should, too.
The Fibonacci sequence provides the mathematical basis of the Elliott Wave Principle. The stock market’s price pattern builds fractally into similar patterns of increasing size. Familiarity with these patterns can prove incredibly useful to investors.
In the course, you’ll learn this and more:
How the Golden Ratio can help you see trading opportunities.
What the most important Fibonacci relationships are.
How Fibonacci relationships can help add confidence to your wave count.
How to project valuable time and price targets using Fibonacci dividers.
Elliott Wave Plus Informed Subscribers on Friday Morning of an Imminent Up Move in the Stock Market This Week

Elliott Wave Plus Informed Subscribers on Friday Morning of an Imminent Up Move in the Stock Market This Week
As we were headed into the weekend last week (Friday, May 15), many Elliotticians and market forecasting services were content holding on to their bearish positions regarding the stock market, and specifically the S&P-500. The Fed had previously stated that more measures were likely going to be needed to pull the economy out of its current downturn, Buffett was selling off millions of dollars of shares, and talk of major department stores filing for bankruptcy flooded the news. All of which made a very bearish outlook to almost every market forecaster . . . except from us.
Who Could Have Predicted This Huge Down Move In The Market?
On November 15, 2019, the S&P-500 reached 3120 for the first time ever. For the next 63 trading days, the S&P continued relentlessly higher, topping on Feb 19 at 3393. Just four days later, the S&P was back down to 3120, almost instantly erasing three full months of gains! Nobody could have seen that coming ahead of time, could they? We know of at least one person who did.
Have We Reached An Unsustainable Situation?

Gold & Bonds are typically correlated. As of this writing, that historic relationship appears to be intact. Compare that to Gold & the U.S dollar. Those two items typically move opposite (inverse) of each other. However, since mid-July 2019, they have generally been moving up and down together.
Bonds, which are the most popular alternative to stock ownership in the investment world, typically move opposite of the stock market. However, ever since the start of the new year (2020), stocks, bonds, gold and the US Dollar have all been rallying together. Is this a distortion that has developed because of mid-October 2019 Fed announcement of QE? Many think so. If so however, there was a delayed reaction of 2.5 months.
Is The Stock Market Losing Upward Momentum?

The most publicized stock market indices continue to hover near all-time highs, but is this market losing momentum? The answer is YES. Examine the following multi-timeframe screenshots of the Dow Jones Industrial Average (DJIA) with a standard RSI indicator on the bottom of the screen. The loss of momentum is clearly shown in the form of bearish RSI divergence.
Is a Dow Theory Non-Confirmation In Play?
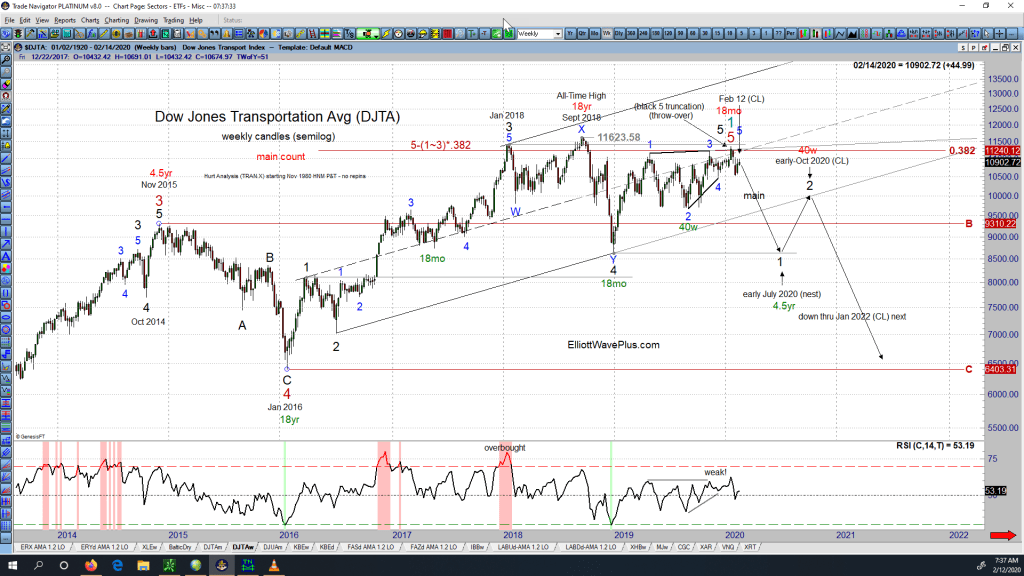
The original Dow Theory states that the market is in an upward trend if either the industrial or transportation index advances above a previous important high and is accompanied or followed by a similar advance in the other average. For example, if the Dow Jones Industrial Average (DJIA) climbs to a new all-time high, and the Dow Jones Transportation Average (DJTA) follows suit within a reasonable period of time, the upward trend is confirmed.
Trading the DOW with Precision Timing!
In late May, Sid projected a road map for the DOW, calling for an early June bottom and a late July top. Check out this video including excerpts from Sid’s June 2 and June 9, 2019 webinars, which included amazingly accurate calls for the recent multi-week swing low and swing high in the DJIA (Dow Jones Industrial Average):