There’s an FOMC meeting and announcement next week. What’s the likely market reaction in silver?

My work as a market technician is generally based on the premise that markets move based on technical aspects derived from prior price action. However, very large players with an agenda (ie: central banks around the globe) are actively involved in the markets. Can looking at both the technical and the influence of the FED provide greater insight into market forecasts? Let’s take a look.
10-Year Treasury Yields Have “Broken Out” to a New Multi-Year High. Will Yields Continue Higher?
Yesterday’s market jolt, according to the talking heads on financial propaganda TV was due to 10-year treasury yields “breaking out” above their Dec 2013 high. I’m sure this slight new high invalidated a few Elliott Wave counts, and “confirmed” a few others.
How I Eliminated Emotion and Directional Bias from my Elliott Wave Counts – A blog post by Sid Norris of ElliottWavePlus.com
I’ve been labeling charts using Elliott Wave theory for a very long time. I’ve also always tracked the Elliott Wave interpretations (wave counts) from several published wave counters over the years. Almost everyone familiar with Elliott Wave theory knows that . .
The Current State of the US Stock Market, the US Dollar, and Gold. A free blog post by Sid Norris of ElliottWavePlus.com
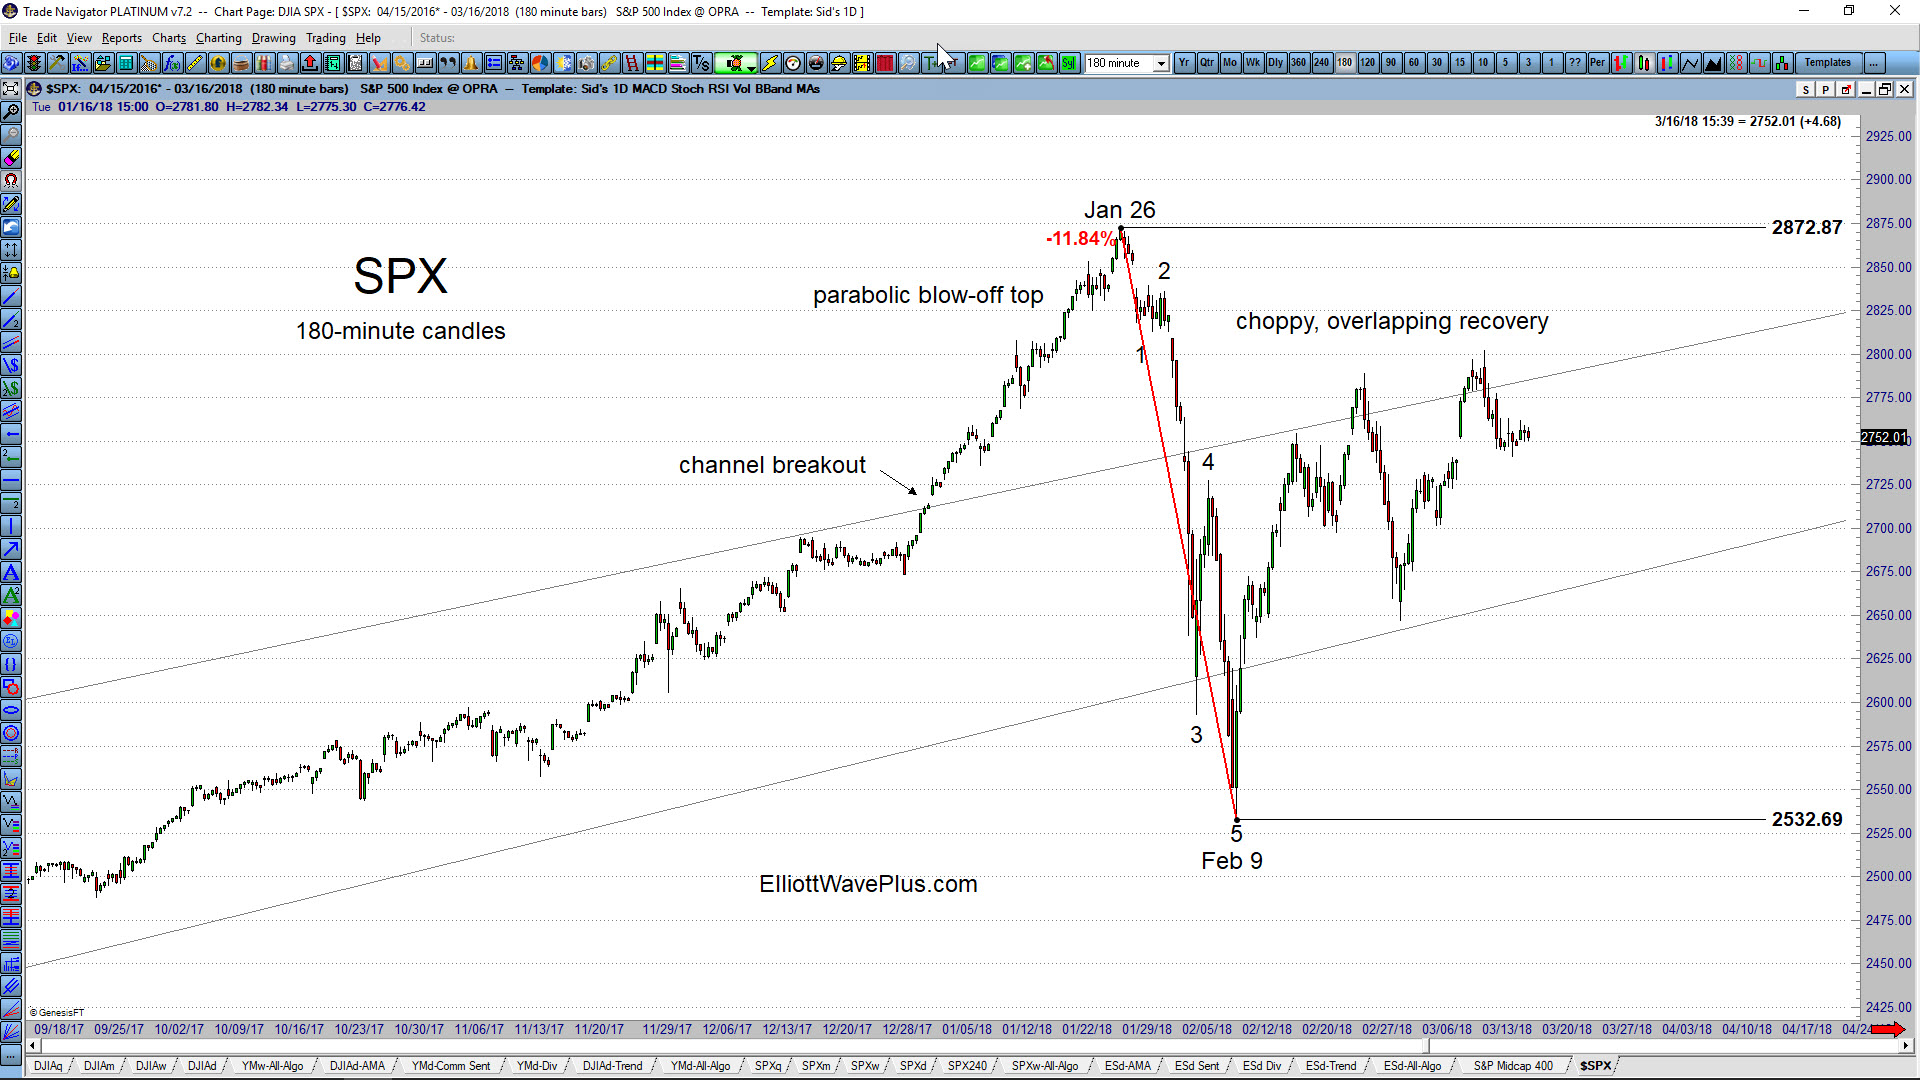
The S&P-500: The January rise in the US stock market went parabolic before topping on January 26. The 11.84% drop over the next 2 weeks (thru February 9) carved out a clear 5-wave impulse to the downside. The recovery so far appears to be choppy, overlapping, and corrective. From an Elliott Wave perspective, the aggressive move down thru Feb 9 is therefore very likely to be a wave 1 of a new downtrend, or a wave A within a 4th wave zigzag. Therefore, another 5-wave wave structure to the downside, taking out the Feb 9 low of 2532.69 would be a high probability expectation. Also possible within Elliott Wave theory is that the drop from Jan 26 thru Feb 9 was wave A within a wave 4 triangle. Only 4 of the 5 legs of a triangle are required to be a zigzag or zigzag combination. One of the legs can be something else, including a 5-wave impulse.
What’s Next for the US Dollar? (by Sid Norris of ElliottWavePlus.com)

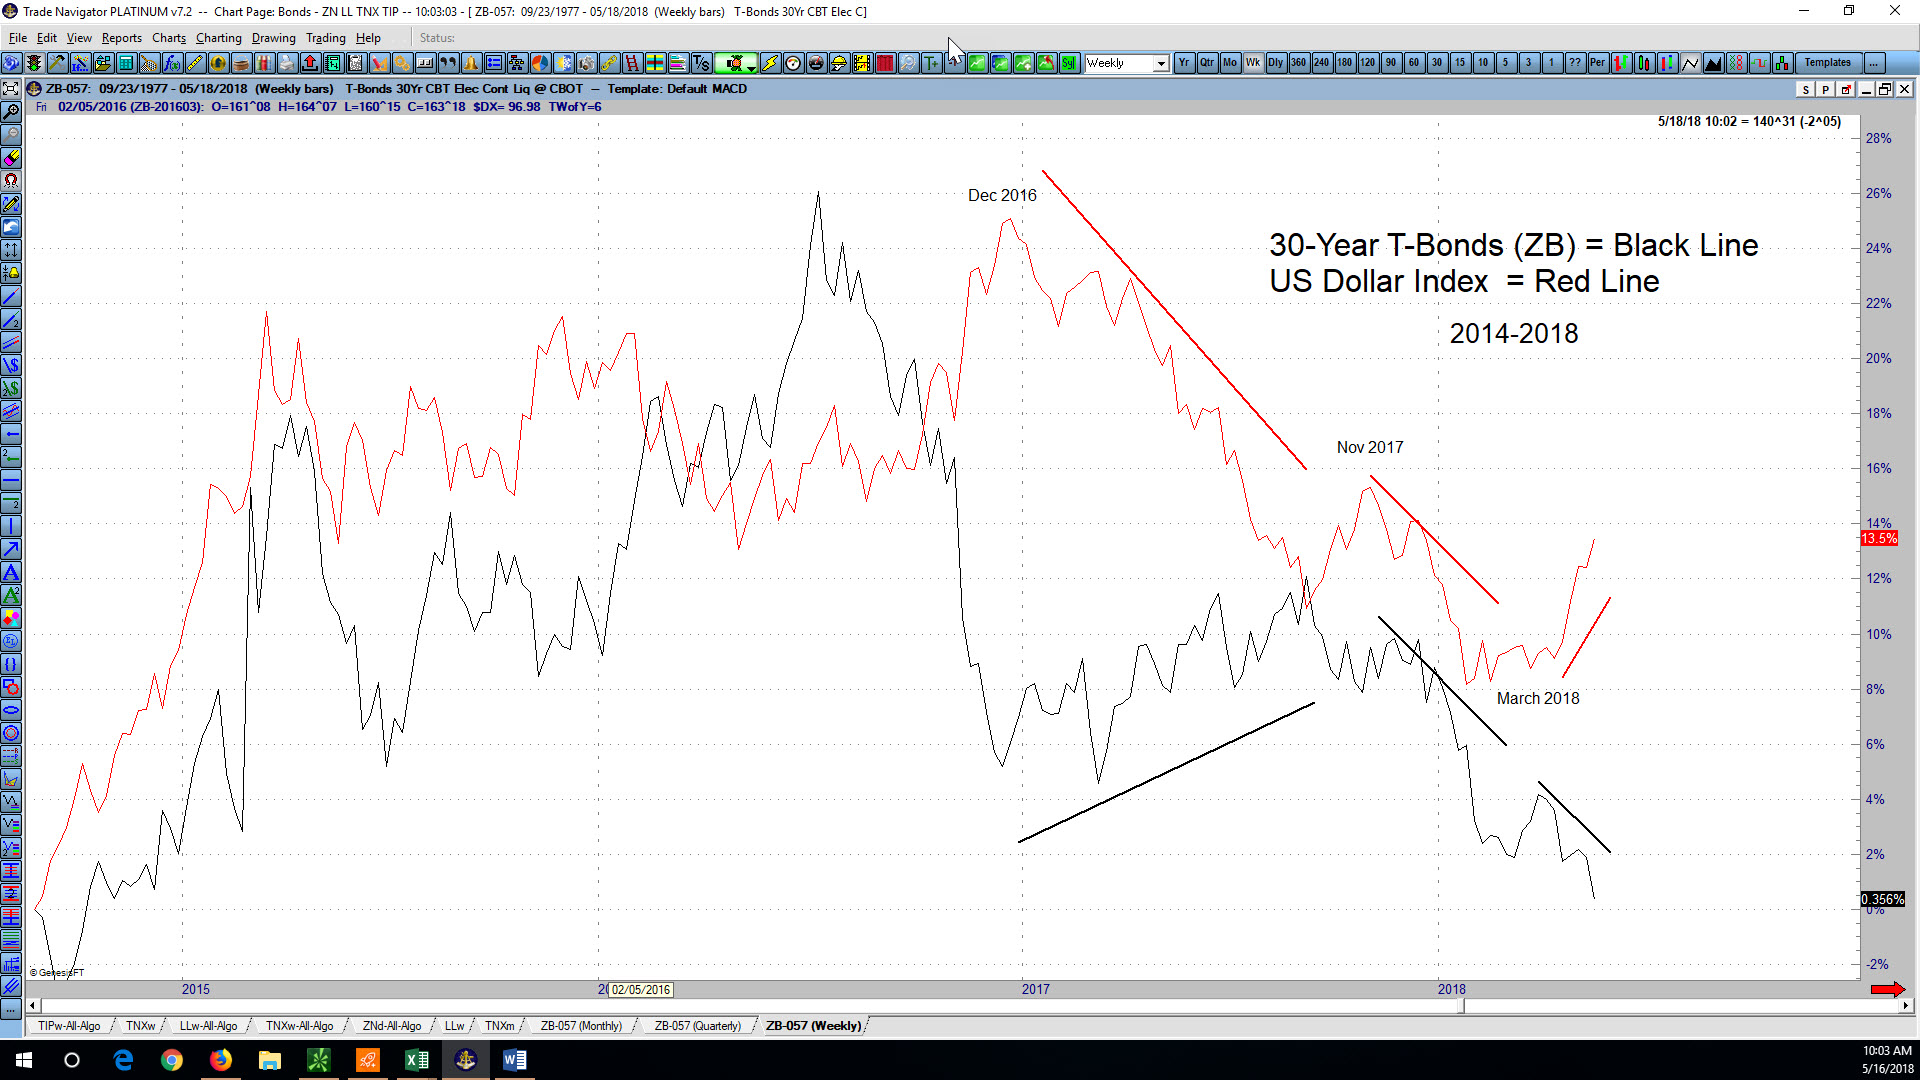
The US Dollar has been quite weak since the beginning of last year. Will it continue to weaken? The monthly chart below shows my long-time main Elliott Wave count for the US Index, an unfinished ending contracting diagonal starting at the 1985 high. This wave count correctly expected the US Dollar to top near a .618 retacement of the downward wave from July 2001 through March 2008. That top came in early January 2017, and the Dollar has surprised many by moving strongly lower ever since. Hurst cycle analysis also correctly projected that top, and from a long-term perspective is quite bearish the Dollar moving forward, potentially all the way to the year 2027.
Thoughts on the Current State of the Stock Market (and other stuff) – A blog post by Sid Norris from ElliottWavePlus.com

Without further ado, here are the current combined Hurst projections on several items of interest:
1) US Stock Market: a major top in late 2017 is expected, to be followed by an ABC correction through the year 2024. (And no, I haven’t called the top yet like those super blogging, email blasting, google search manipulators! (-:) From an Elliott Wave perspective, the 5-wave impulse up from the March 2009 low is likely to end soon, though. That bull market will have lasted about 8.5 years, so even if the 2009-2017 bull was a very bullish cycle-degree wave 1 (my main count), a multi-year (cycle-degree) correction would be next.
Sid’s timely call on Natural Gas during the May 14, 2017 weekly “Counts” Webinar

Sid’s Timely Call on Natural Gas (NG Futures Contract) During his May 14, 2017 Weekly “Counts” Webinar. Each week, Sid Norris of ElliottWavePlus.com holds a Sunday webinar for “Pro Plan” subscribers. During the session, he presents his Elliott Wave counts and associated Fibonacci price targets for many of the world’s major stock markets, commodities, currencies, […]
“The Best Advice I Ever Received” – a guest blog post by EW+ Pro-Plan subscriber Geno Jorgensen

Quick Introduction from Sid: I’ve come to learn over the years that many of my subscribers are very smart, highly successful people. They often look to my analysis simply as a second opinion to their own market analysis and trading techniques, which they’ve honed over decades. So I recently asked my paid subscribers if anyone […]
Did a 9-yr cycle trough just occur in the NZD/USD currency pair?

Did a 9-yr cycle trough just occur in the NZD/USD currency pair? I’ve been tracking the NZD/USD currency pair using both the Hurst nominal model and the gold 7.4-yr model for quite some time now. One would think that this pair would work nicely with the 7.4-yr gold model, since gold and the down-under currency […]
Sid’s Highly Accurate Call on GDX during the April 4, 2017 Weekly “Counts” Webinar

Each week, Sid Norris of ElliottWavePlus.com holds a Sunday webinar for “Pro Plan” subscribers. During the session, he presents his Elliott Wave counts and associated Fibonacci price targets for many of the world’s major stock markets, commodities, currencies, and bonds. Hurst cycle analysis and retail trader sentiment are also strongly considered. Screenshots of all the […]