Thank You New Email Subscribers! Here’s More Info About Our Paid Subscription Coverage

Thank You New Email Subscribers! Here’s More Info About Our Paid Subscription Coverage
Thank you for signing up for Elliott Wave Plus emails! We try to keep subscribers up to date on what’s going on here at ElliottWavePlus.com without flooding your inbox. Today we would like to show you an inside look at the Pro Plan and Premium Plan subscriptions. As a thank you, we will throw in some bonus material on Crypto currencies, specifically Bitcoin’s Elliott Wave roadmap – a $25 value.
Quarterly Premium Plan Webinar | Free Bonus Content

Every quarter here at ElliottWavePlus.com, we hold a live “Premium-Plan” Webinar, and invite all of our paying subscribers at all levels. The purpose of the webinar is to educate subscribers on the vast array of information provided at all subscription levels. During this (April 7, 2020) webinar, we explained the Nightly Algo Report, and revealed the most current optimized (3-year) backtest settings and results associated with our proprietary momentum algo, in downloadable excel format.
Has Silver Delivered An Important Message About Gold? – Gold & Silver Analysis

Gold and Silver are traditionally very highly correlated. When one moves up, the other moves up, and vice versa. They may not move the same percentages, but the directionality is typically identical. During Silver’s recent capitulation move to below 12 cents per ounce, a level last seen in Jan 2009, Gold stayed above 1450. If Silver’s “capitulation” is finished, and that idea is supported by the fact that it has already rallied 28% from that low, why would gold puke out now?
And yet, those “mainstream” Elliotticians continue to be deadly bearish with their Gold wave count because they think they saw five waves down from 2011 thru 2015. The time to consider the possibility that that was not a 5-wave down structure is WAY overdue, don’t you think? Maybe it was a WXY, or WXYXZ structure. That has been my main wave count all along. Why? Hurst Cycle Analysis. My secret weapon.
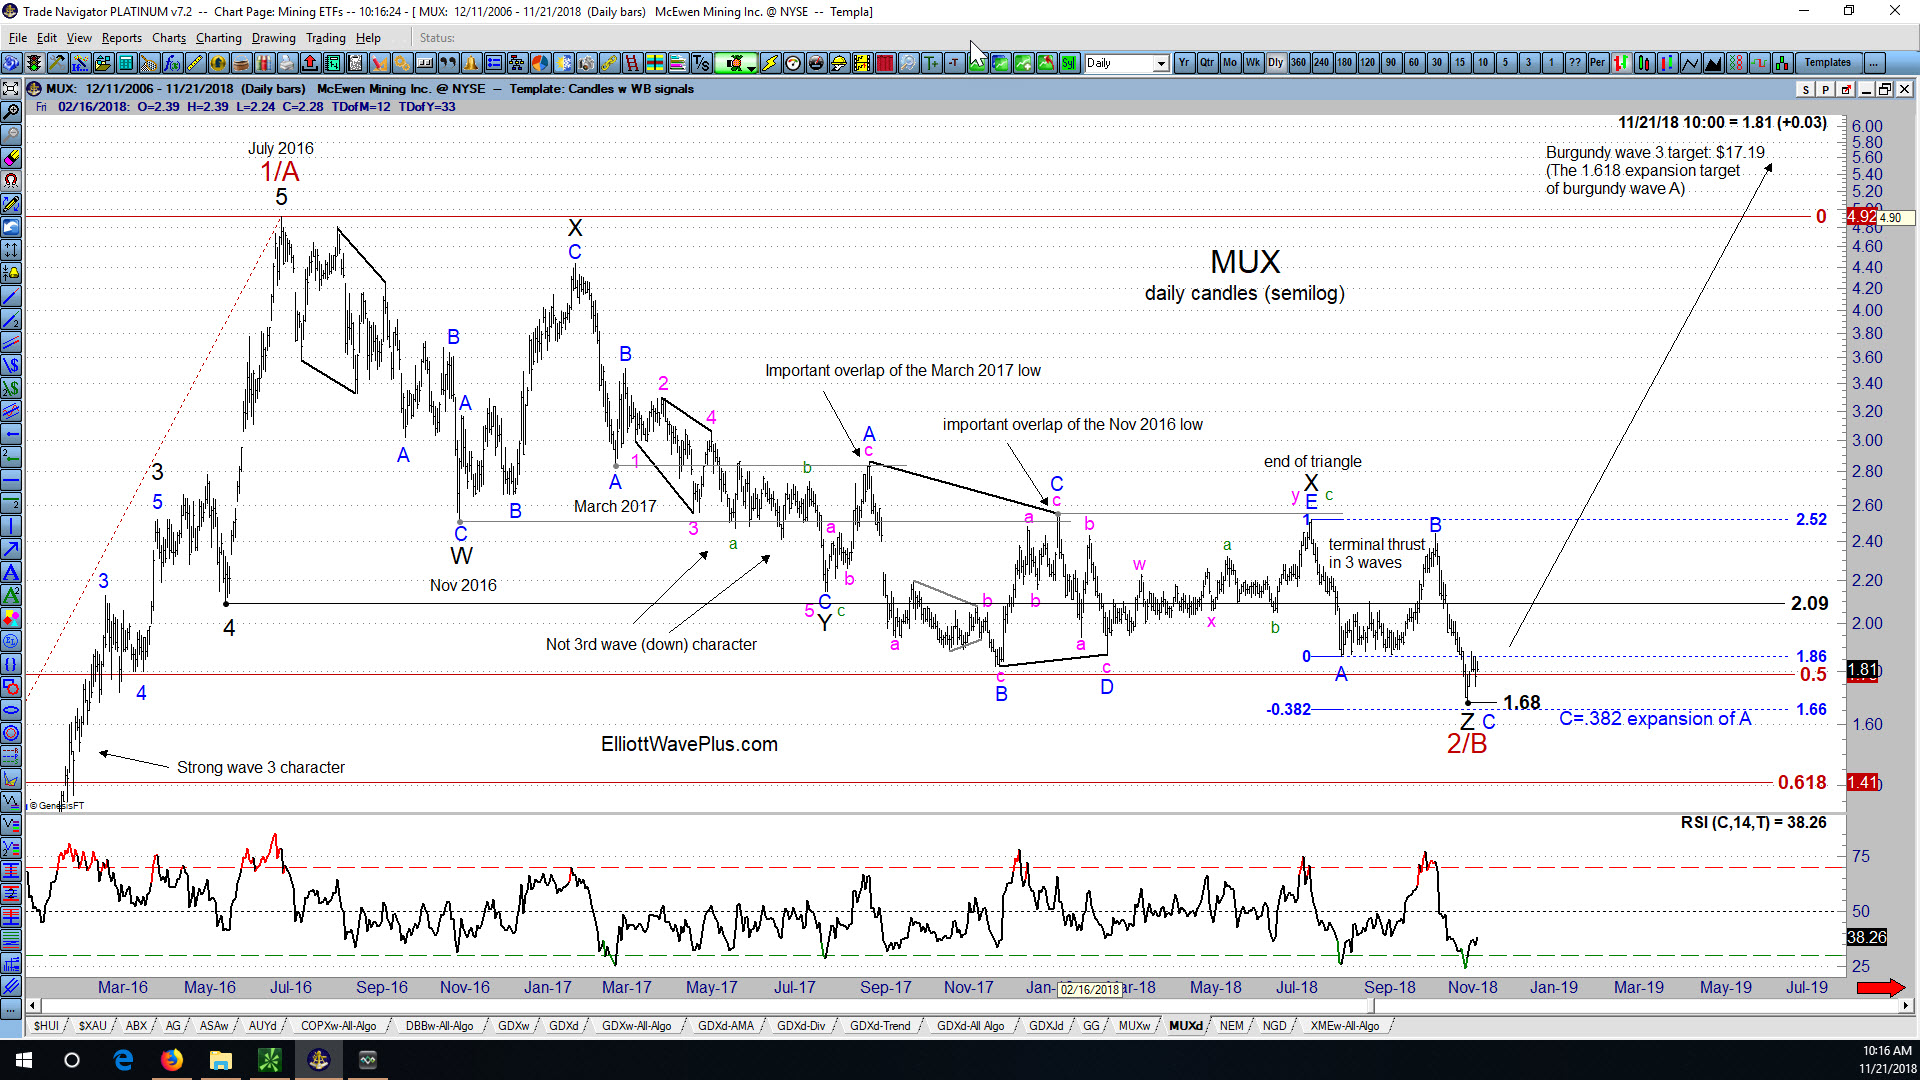
Sid’s Elliott Wave Analysis of McEwen Mining Inc. (ticker symbol MUX)

After my recent post on First Majestic Silver Corp. (AG), I’ve received a number of requests for my current wave count on McEwen Mining Inc. (MUX), another highly regarded stock in the precious metals mining sector.
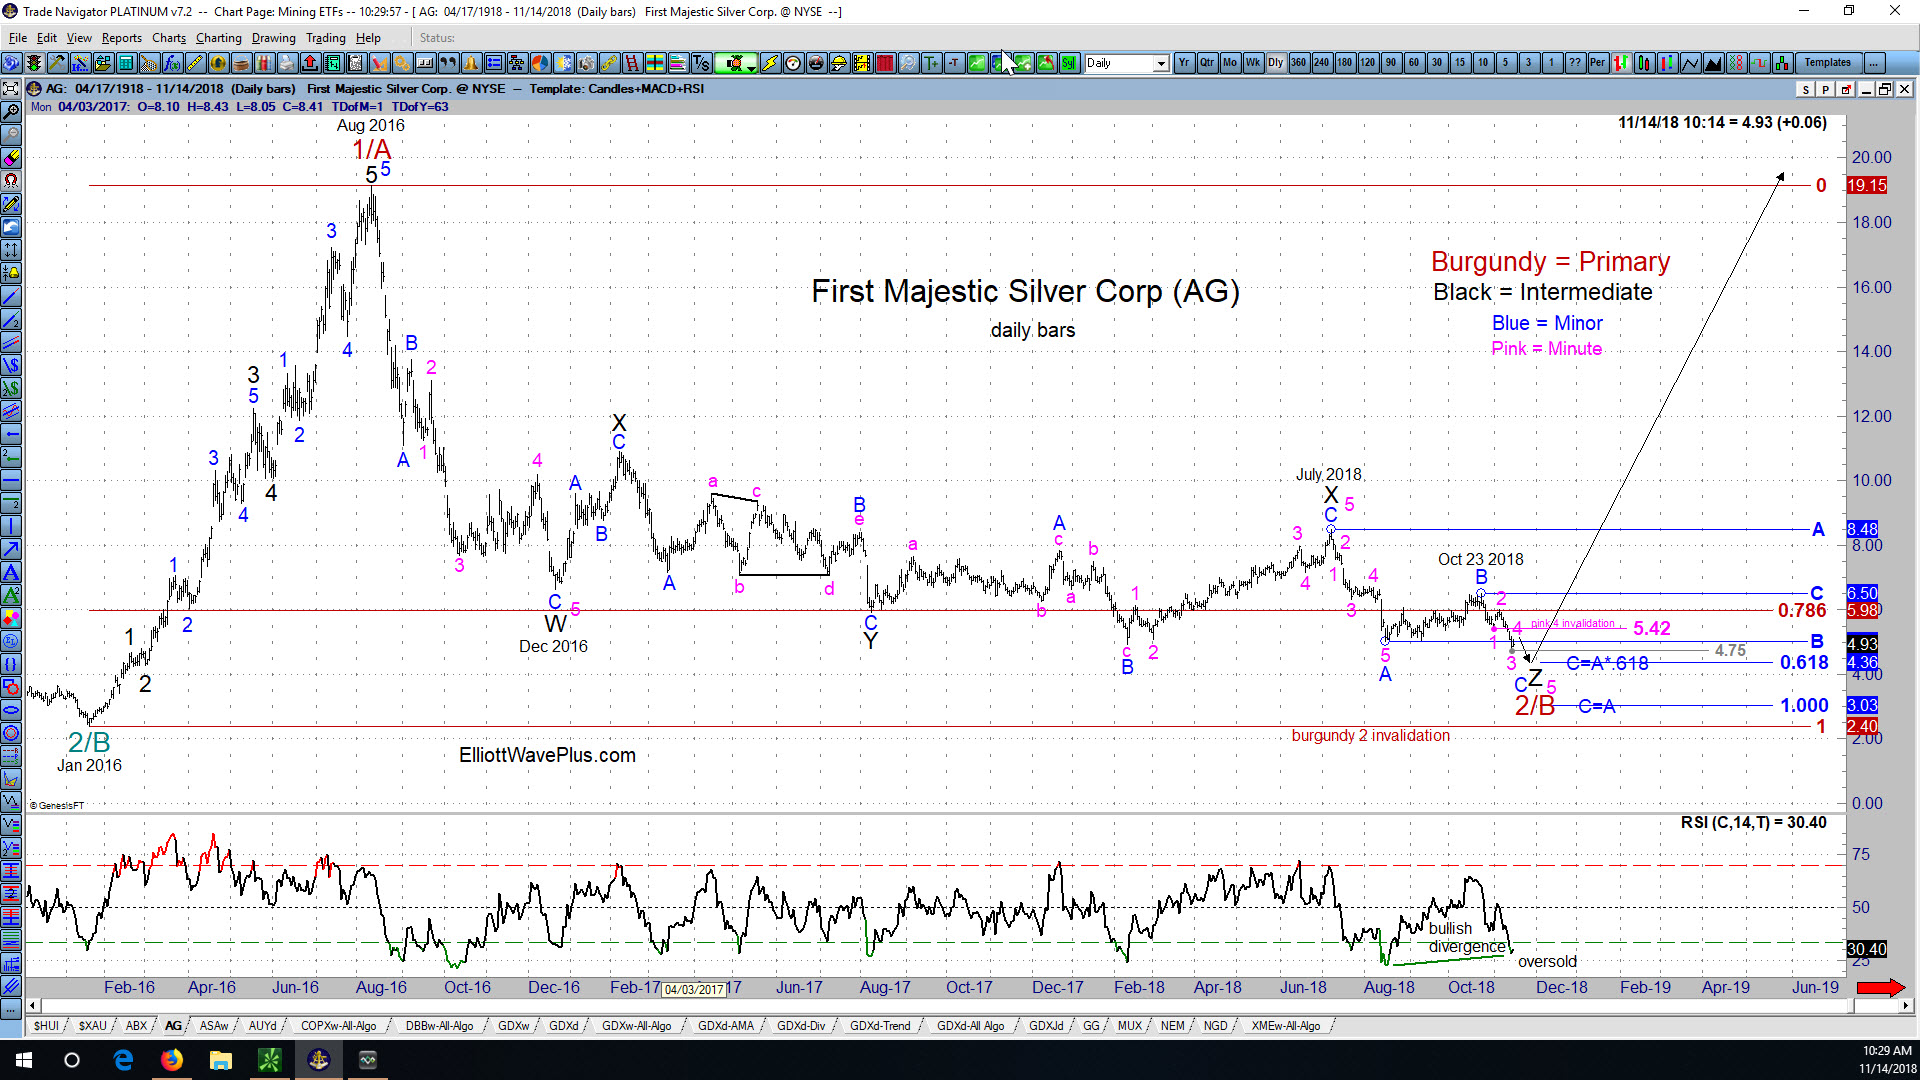
Sid’s Elliott Wave Analysis of First Majestic Silver Corp (ticker symbol AG)

Since AG’s August 2011 high of $26.88, the company’s stock price tumbled all the way down to $2.40 per share in January 2016. Let’s look at the price action in AG starting at that January 2016 low from an Elliott Wave perspective. (Click on the chart to enlarge)
There’s an FOMC meeting and announcement next week. What’s the likely market reaction in silver?

My work as a market technician is generally based on the premise that markets move based on technical aspects derived from prior price action. However, very large players with an agenda (ie: central banks around the globe) are actively involved in the markets. Can looking at both the technical and the influence of the FED provide greater insight into market forecasts? Let’s take a look.
What’s Next for the US Dollar? (by Sid Norris of ElliottWavePlus.com)

The US Dollar has been quite weak since the beginning of last year. Will it continue to weaken? The monthly chart below shows my long-time main Elliott Wave count for the US Index, an unfinished ending contracting diagonal starting at the 1985 high. This wave count correctly expected the US Dollar to top near a .618 retacement of the downward wave from July 2001 through March 2008. That top came in early January 2017, and the Dollar has surprised many by moving strongly lower ever since. Hurst cycle analysis also correctly projected that top, and from a long-term perspective is quite bearish the Dollar moving forward, potentially all the way to the year 2027.
Precious Metals and Mining Stocks Were Up Big Yesterday. Is the Bottom “In”?
Gold, Silver and Platinum were up big again on a “Fed” day yesterday, a recurring motif in recent quarters. Yesterday’s bounce was fairly large, especially in many of the large and mid-cap precious metals mining stocks. I’ve been projecting for a long time that a large cycle trough was due near year-end 2017, so is the bottom in on precious metals or not? Let’s take a look.
“The Best Advice I Ever Received” – a guest blog post by EW+ Pro-Plan subscriber Geno Jorgensen

Quick Introduction from Sid: I’ve come to learn over the years that many of my subscribers are very smart, highly successful people. They often look to my analysis simply as a second opinion to their own market analysis and trading techniques, which they’ve honed over decades. So I recently asked my paid subscribers if anyone […]
Did a 9-yr cycle trough just occur in the NZD/USD currency pair?

Did a 9-yr cycle trough just occur in the NZD/USD currency pair? I’ve been tracking the NZD/USD currency pair using both the Hurst nominal model and the gold 7.4-yr model for quite some time now. One would think that this pair would work nicely with the 7.4-yr gold model, since gold and the down-under currency […]


