Thank You New Email Subscribers! Here’s More Info About Our Paid Subscription Coverage
Thank You New Email Subscribers! Here’s More Info About Our Paid Subscription Coverage
Thank you for signing up for Elliott Wave Plus emails! We try to keep subscribers up to date on what’s going on here at ElliottWavePlus.com without flooding your inbox. Today we would like to show you an inside look at the Pro Plan and Premium Plan subscriptions. As a thank you, we will throw in some bonus material on Crypto currencies, specifically Bitcoin’s Elliott Wave roadmap – a $25 value.
Quarterly Premium Plan Webinar | Free Bonus Content

Every quarter here at ElliottWavePlus.com, we hold a live “Premium-Plan” Webinar, and invite all of our paying subscribers at all levels. The purpose of the webinar is to educate subscribers on the vast array of information provided at all subscription levels. During this (April 7, 2020) webinar, we explained the Nightly Algo Report, and revealed the most current optimized (3-year) backtest settings and results associated with our proprietary momentum algo, in downloadable excel format.
Has Silver Delivered An Important Message About Gold? – Gold & Silver Analysis
Gold and Silver are traditionally very highly correlated. When one moves up, the other moves up, and vice versa. They may not move the same percentages, but the directionality is typically identical. During Silver’s recent capitulation move to below 12 cents per ounce, a level last seen in Jan 2009, Gold stayed above 1450. If Silver’s “capitulation” is finished, and that idea is supported by the fact that it has already rallied 28% from that low, why would gold puke out now?
And yet, those “mainstream” Elliotticians continue to be deadly bearish with their Gold wave count because they think they saw five waves down from 2011 thru 2015. The time to consider the possibility that that was not a 5-wave down structure is WAY overdue, don’t you think? Maybe it was a WXY, or WXYXZ structure. That has been my main wave count all along. Why? Hurst Cycle Analysis. My secret weapon.
Who Could Have Predicted This Huge Down Move In The Market?

On November 15, 2019, the S&P-500 reached 3120 for the first time ever. For the next 63 trading days, the S&P continued relentlessly higher, topping on Feb 19 at 3393. Just four days later, the S&P was back down to 3120, almost instantly erasing three full months of gains! Nobody could have seen that coming ahead of time, could they? We know of at least one person who did.
Have We Reached An Unsustainable Situation?

Gold & Bonds are typically correlated. As of this writing, that historic relationship appears to be intact. Compare that to Gold & the U.S dollar. Those two items typically move opposite (inverse) of each other. However, since mid-July 2019, they have generally been moving up and down together.
Bonds, which are the most popular alternative to stock ownership in the investment world, typically move opposite of the stock market. However, ever since the start of the new year (2020), stocks, bonds, gold and the US Dollar have all been rallying together. Is this a distortion that has developed because of mid-October 2019 Fed announcement of QE? Many think so. If so however, there was a delayed reaction of 2.5 months.
When the Stock Market Goes Down, Gold Goes Up. Right?

During the Jan 19 webinar, Sid showed an intermediate-term chart of Gold and the S&P-500 Index, one overlaid upon the other. The chart clearly showed that gold and the stock market don’t always move inversely, as many seem to believe. Sometimes the two items move opposite each other, but other times they generally move together, in positive correlation. For instance, since early October 2019, the two items have generally been moving to the upside together.
This video clip, taken from that January 19 weekly “Counts” webinar includes Sid’s discussion of the above myth, as well as his chart of Gold vs. the S&P. For those who believe that Gold will “save them” when the stock market crashes next, the video is worthy of consideration.
Are there potential trading profits to be made on both the upside and downside of the S&P as well as Gold? Absolutely. But the two items really should be analyzed and traded independently.
Bonus screenshot from the January 26 weekly webinar. Notice how highly correlated the S&P and the XAU (Gold & Silver Sector Index) have been since early October.
The Quarterly Premium Plan Webinar

Quarterly Premium Plan Webinar 1-17-20. During this free webinar, we cover multiple topics such as:
The different levels of services offered at ElliottWavePlus.com (Crypto Plan, Basic Plan, Pro Plan, and our Premium Plan), How to navigate within our ElliottWavePlus.com website, Helping yourself to our Resources, Our Blog and how to use it, How to utilize our top-tier service – The Premium Plan.
Sid’s Current Analysis on Gold – January 12, 2020

Sid Norris of ElliottwavePlus.com, during the Sunday, January 12, 2020 weekly “counts” webinar for Pro-Plan subscribers describes his Elliott Wave count and associated Fibonacci price targets on Gold.
Trading Gold with Precision Timing!
In late May of 2019, while other market forecasting services were suggesting that gold would continue further to the downside, Sid was bullish. Those other forecasters remained bearish until gold broke out above the 2016 high. What good did that do anyone? Now, with gold only about 5% percent above that 2016 high, those other guys are very bearish on gold once again. Why? Because Elliott Wave theory, when used alone, is dangerously subjective. However, when Elliott Wave is combined with a dissimilar but equally robust methodology (like Hurst Cycle Analysis), a different forward roadmap often emerges.
Sid’s Elliott Wave Analysis of McEwen Mining Inc. (ticker symbol MUX)
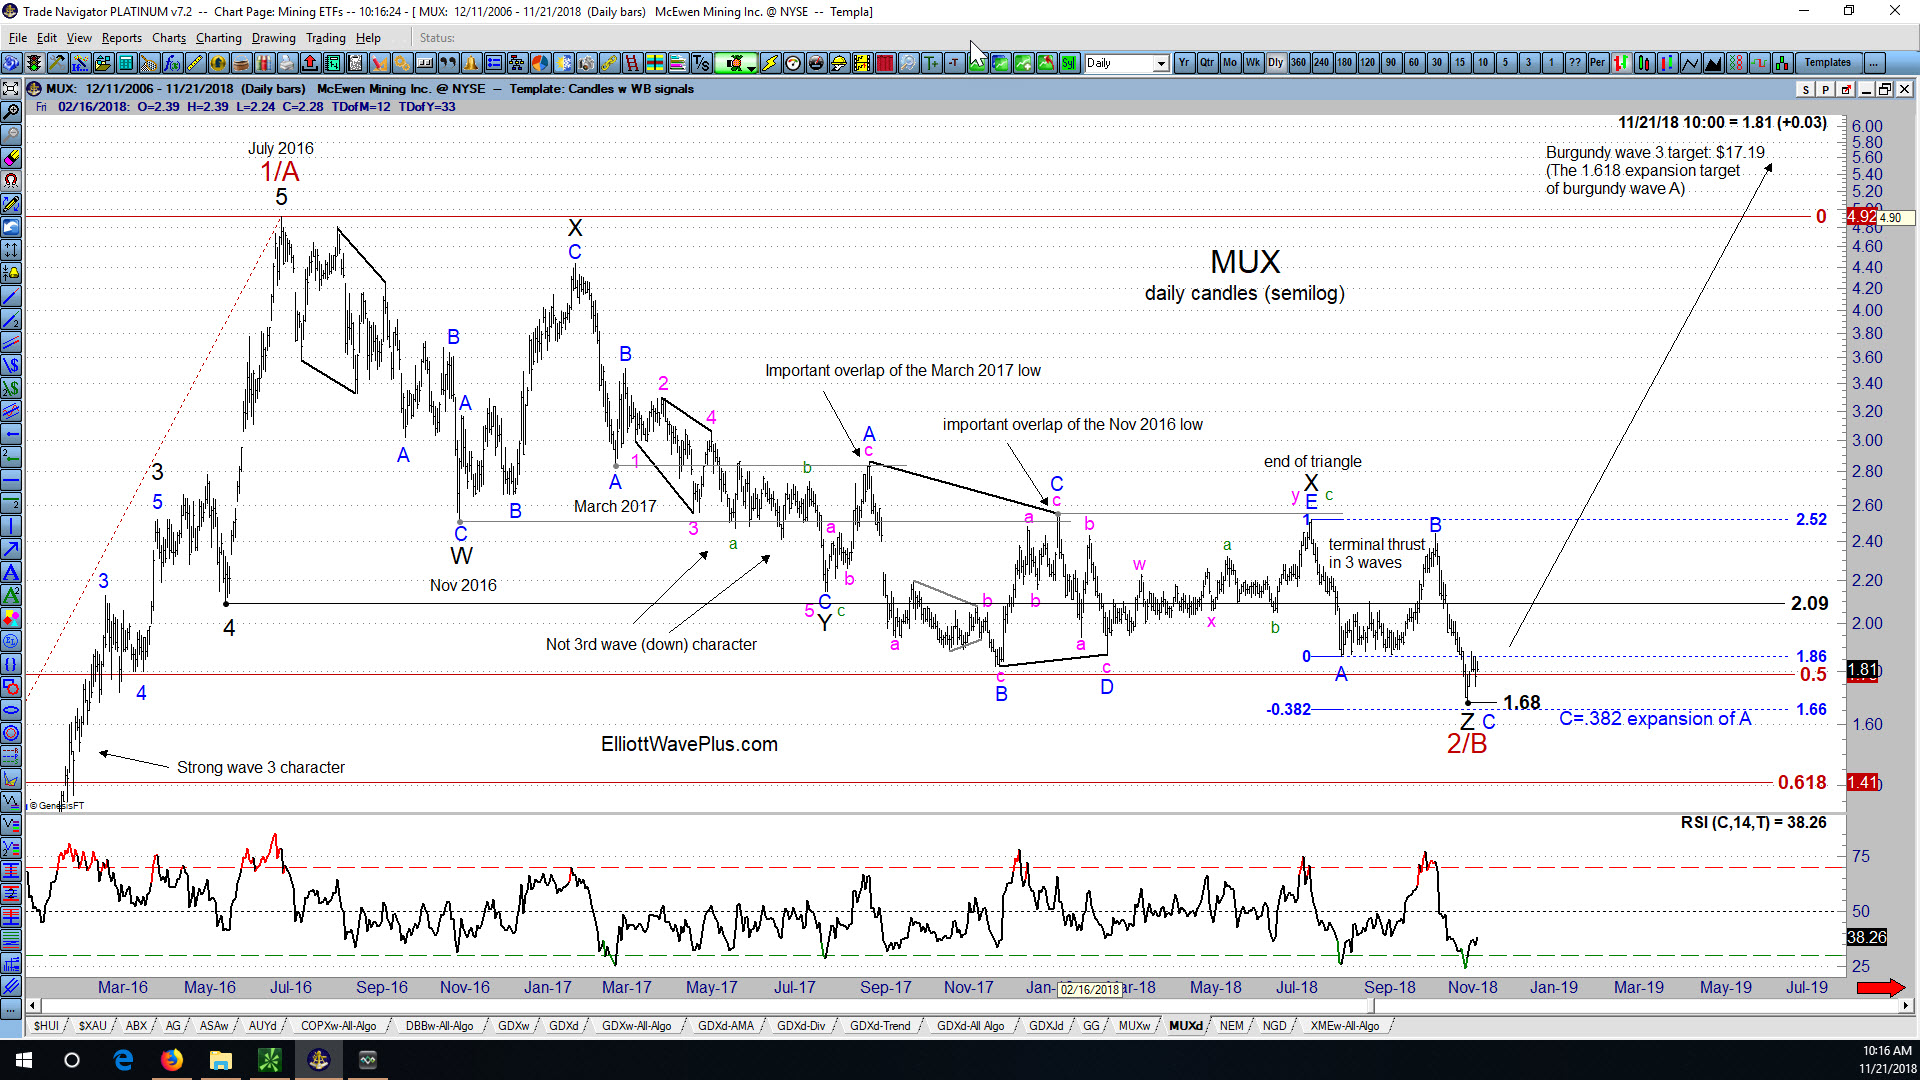
After my recent post on First Majestic Silver Corp. (AG), I’ve received a number of requests for my current wave count on McEwen Mining Inc. (MUX), another highly regarded stock in the precious metals mining sector.